In this video I describe how we can describe dispersion or variability in nominal data by calculating a variation ratio. This is a simple measure of spread that tells us the frequency of scores that differ from the mode, which is the only measure of central tendency that we have for nominal data.
Video Transcript
Hi, I’m Michael Corayer and this is Psych Exam Review. In this video we’re going to start thinking about how spread out our data is. This can be referred to as spread, dispersion, variation, variability, or scatter. Just knowing the central tendency doesn’t tell us how spread out the scores are from the mean, the median, or the mode.
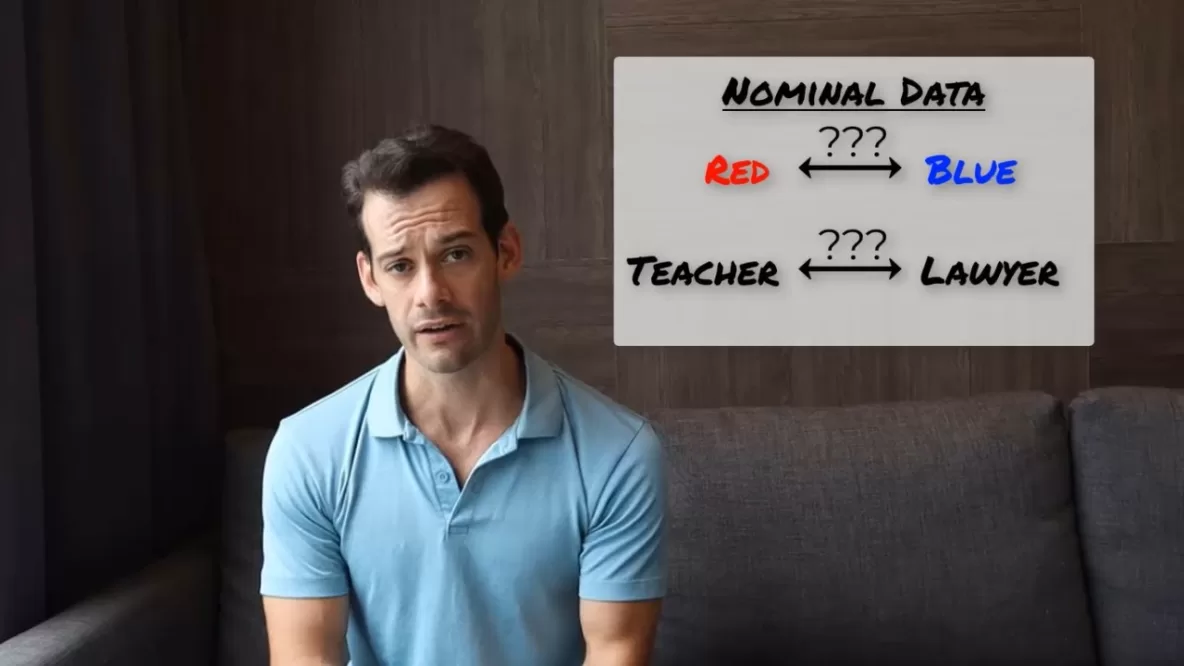
If we have nominal data then we’re dealing with named categories that can’t be ordered or ranked and this means that we can’t really think about the distances between responses. The only measure of central tendency that we have is the mode and it doesn’t really make sense to talk about how far other responses are from the mode. We can’t talk about the distance from red to blue, or from teacher to lawyer. But what we can do is calculate what’s called a variation ratio. So the variation ratio tells us how many responses are not the mode. It gives us a percentage or the frequency of scores that are not at the mode and this helps us to get a sense of whether the mode was really popular, or if it was just slightly preferred compared to our other categories.
In order to calculate the variation ratio all we need to do is take the frequency of responses at the mode, so how many responses were the mode, then divide that by the total number of responses and then subtract this value from 1. So our formula would be variation ratio equals 1 minus the frequency of responses at the mode divided by n. This will give us a value between 0 and 1.
The greater the variation ratio the more variation or variability we have in our data. So if we had a total of 20 responses and 5 of these were at the mode then we would take 5 divided by 20 and then subtract this from one. This will give us a variation ratio of 0.75 and that would mean that 75 percent of our responses were not at the mode. On the other hand, if I had 20 responses and all 20 were at the mode then this would give me a variation ratio of 0 meaning that my data don’t vary at all.
If we have data that are ordinal interval or ratio that means we can start thinking about distances between responses and that means we’ll have more detailed ways of calculating the dispersion or the variability in our data. And we’ll look at those in the next few videos. I hope you found this helpful, if so, let me know in the comments, like and subscribe, and make sure to check out the hundreds of other psychology tutorials that I have on the channel. Thanks for watching!