In this video I explain how skewness in a sample may be caused by a floor or a ceiling effect, in which the measurement isn’t able to capture variability at the low or high end of a population’s distribution. A floor effect will result in a positively skewed sample, while a ceiling effect will result in a negatively skewed sample, even if the population is normally distributed.
Video Transcript
Hi, I’m Michael Corayer and this is Psych Exam Review. In the video explaining positive and negative skew I mentioned that we might see skew in our sample because of random chance. So we could have a normally distributed population but we just happen to get a sample that shows skew. It could also be the case that the population is also skewed. So we have to skew in the population and then our sample is accurately reflecting this skew.
But it could also be the case that we have a normally distributed population but the way that we’re measuring the variable is introducing skew into our sample. This is because the measurement that we’re using is not able to capture all of the variability; it’s not able to differentiate scores either at the lower or the upper end of the distribution and when this occurs these are known as floor or ceiling effects.
A floor effect occurs when a measurement isn’t able to differentiate the lower end of the distribution very well. So what happens is people with lowest scores all end up stacked up at the same point, even though they actually differ. It’s just that the measurement can’t detect those differences, and so we appear to have very high frequency at that point in the distribution. And then as we move to higher scores for this variable the measurement is able to detect the differences and so the scores become more spread out, we see more variability. And so what happens is we’ll have positive skew, right? We have lots of scores at the lower end of the distribution because the measurement can’t differentiate them well, so they appear to have high frequency, and then as we move to higher scores where it’s better able to differentiate, scores become more spread out and we have this long tail extending out to the right.
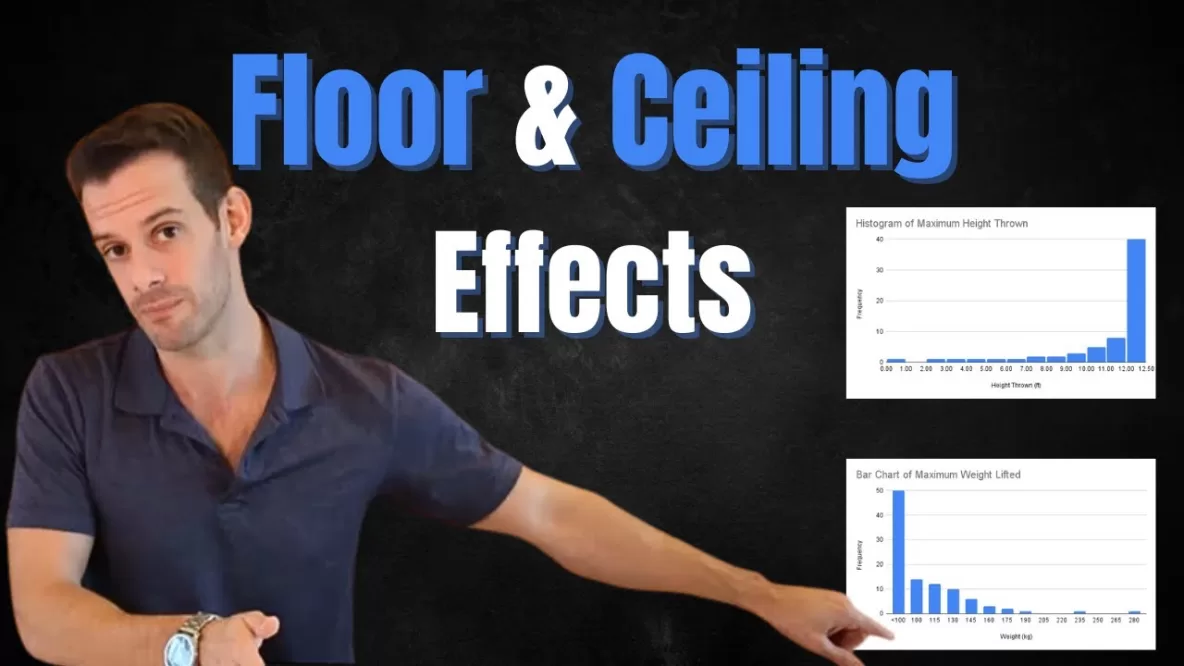
Let’s imagine that we wanted to measure the variable of strength in a population of men and let’s assume for this example that the population distribution is actually a normal distribution. And let’s say we decided to measure this by loading up a barbell and then we asked men to deadlift this weight. Then we add weight to the barbell until we reach the point that they can’t lift it and then we record the highest weight that they successfully lifted. Now let’s also say, for some strange reason we decided to start with a weight of 100 kilograms.
Now if we did that what’s going to happen is there’s going to be a portion of men who aren’t able to lift this at all. And so they’re going to get a score of zero because they weren’t able to lift any of the weights. And so what’s going to happen is we’re going to stack up a bunch of scores at zero, not because these men actually have you know a strength score of zero, they actually do differ. Maybe some could have lifted 40 kilograms or 60 kilograms or 80 kilograms but our measurement didn’t allow that to happen. It’s not able to differentiate those scores and so they all end up stacked up at one point in the distribution at zero. And then as we move to higher scores we see that now the measure is able to detect the variability because some men will be able to move up to 120 kilograms or 140 or 200, 250, or 300. We can extend that right tail very far and it’s able to detect differences that exist in the variable at the higher end of the distribution. So as a result when we look at our sample what we’re going to see is a big stack of scores at zero and then a long tail extending out to the right. So we’re going to have a positively skewed distribution of our sample even though it comes from a population that’s normally distributed, and this is because the measurement that we’re using has a floor effect.
This might seem like a somewhat silly example and it seems like kind of an obvious flaw in our measurement but I’ve chosen this for two reasons. The first is that it can operate as a mnemonic so you can remember people not being able to get the weight off the floor as an example of a floor effect, but I’ve also chosen this because it actually occurs in psychological research. Sometimes we investigate things that a lot of participants end up stacking up at zero. So if I’m measuring something like extremely stressful life events and I have a sample of college students I might find that most of them score zero on this scale. They haven’t gone through a divorce, they’re not suffering from a terminal illness, they’ve not had a close loved one die, and so as a result they all stack up at zero even though they actually differ in their life stress. It’s just that this measurement scale isn’t very good at detecting lower amounts of stress even though it might work quite well for higher ends of the distribution.
And the same could be true of our investigating something like severe symptoms of mental illness. Again many of my participants may stack up at zero; they simply don’t have any of the symptoms that are on my list. Whereas in a population where we had people who are suffering from a particular disorder then that scale might be more useful. And this brings up the idea that the same measurement tool may have a floor effect for some populations but not have a floor effect for others. And this could be seen with our weightlifting example. So if I’m testing, you know, untrained college students who have no experience weight lifting, then in that case I’ll probably see a floor effect if I start with a weight of 100 kilograms. But if I took that same starting point and use the same scale, but I went to, you know, competitive power lifters then in that case I’m probably not going to see a floor effect at all. Because all of them can lift 100 kilograms and so what happens is they’re not all stuck at zero and I can see the full range of the distribution of strength within that population of power lifters. So the same measurement scale may have a floor effect in one population but not another.
A ceiling effect is essentially the same problem just now it’s happening at the opposite end of the distribution, where the measurement or the assessment tool isn’t able to differentiate at the highest scores and so they all end up stacked in the same place. So we have a very high frequency at the top end of the distribution and then as we move lower we see more variability. So that means we’ll end up with negative skew in this case. To remember this we could think about having participants throw a ball in the air and we record how high they can throw it but let’s say due to poor planning we end up trying to conduct this study in a room with a 12 foot ceiling. So now if many participants are able to hit the ceiling then they’re all going to get the same score; they’re all going to end up with a score of 12, even though they actually had some variation amongst them. So maybe some of them could have thrown it 15 feet, or 25 feet, or 40 feet in the air, but of course our assessment or our measurement isn’t able to capture that variation and so they all end up with the same score. So now we’d have a very high frequency at a score of 12 and then as we move below that we’ll see more variability. So, you know, this measurement can still tell the difference between, you know, four feet or four and a half feet, or three feet, but once you get to 12 it’s not able to differentiate and so lots of scores end up stacked up at that point. That would be an example of a ceiling effect.
This is also a somewhat silly example and obviously I’ve chosen it as a mnemonic for the ball hitting the ceiling to remind you of a ceiling effect but this can be a real problem for assessment. We don’t want it to be the case that all our participants end up stacked up at the same score, you know, because that’s the highest value they can possibly get. If you took a class and 90% of the class got a perfect score on the first exam, you know, you might be happy with this, but if this kept happening on all the assessments you may start thinking there’s a problem with this, you know? Because it’s probably not the case that, you know, 90% of students have all learned to exactly the same level, right? There probably is variation in those students and you might want to know about it, you know? If you’re in that 90 you might want to know “am I really doing really well or am I just doing okay and the tests are too easy?” you know? “How do I tell?” Well, if we have a ceiling effect on our assessment then you can’t really tell.
Ok, this can be a problem for, you know, psychological assessments. Let’s say I’m doing a study on memory. I don’t want it to be the case that, you know, almost all of my participants remember all of the items on a particular list. In that case maybe the task was just too easy and so I’m not able to assess much about, you know, the higher variability that might exist in memory. And obviously, you know, if you’re assessing intelligence and everybody gets all the questions right on your test then it’s not a very good intelligence test. And the same would apply to personality traits. Let’s say I have some scale to assess agreeableness. Well if it turns out that, you know, someone who’s just slightly agreeable gets the maximum score on this scale, well then it’s not really going to tell you much about variation in the population for agreeableness.
Now this can also be an issue for psychological research because often the tasks that we use have to be fairly short, you know? And this is because of time and budget constraints. You know we can’t necessarily develop a fully comprehensive assessment for something that’s going to really tell us about the full range of variability in the population. Then given that many studies are fairly short, you know, they may only be 10 or 15 minutes then we might run into problems with these ceiling effects, where we start making tasks that are just too simple and, you know, participants are doing too well. On the other hand we don’t want to make them so hard that, you know, everybody gets a zero and we end up with a floor effect.
So it can be a real challenge to create assessments for psychological variables that can capture the full range of variability in the population without having floor or ceiling effects and then also managing to do that in a very short period of time. So that’s floor and ceiling effects and how they play a role in the skewness of a sample. I hope you found this helpful. If so, let me know in the comments, ask any other questions that you have and I’ll try my best to answer them, make sure to like and subscribe, and check out the hundreds of other psychology tutorials that I have on the channel. Thanks for watching!