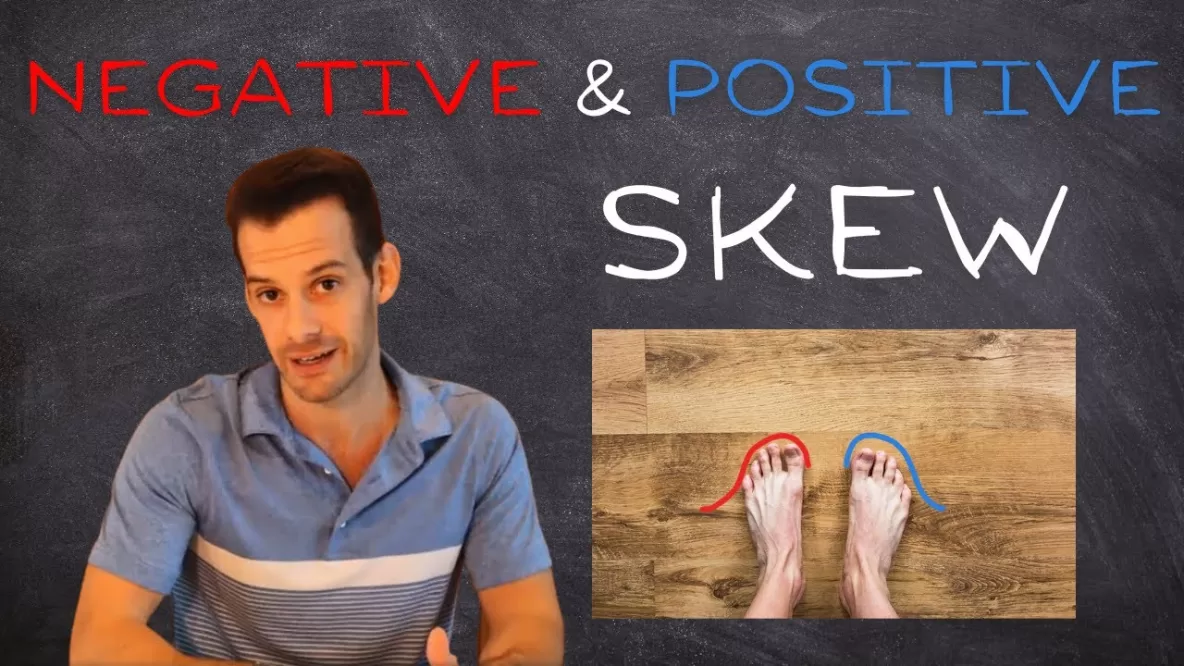
In this video I explain one way in which a distribution can deviate from normality, which is skewness. I explain the difference between positive and negative skew, and how these can be seen in histograms, stem and leaf displays, and … Read More
Exploratory Data Analysis: Stem & Leaf Displays
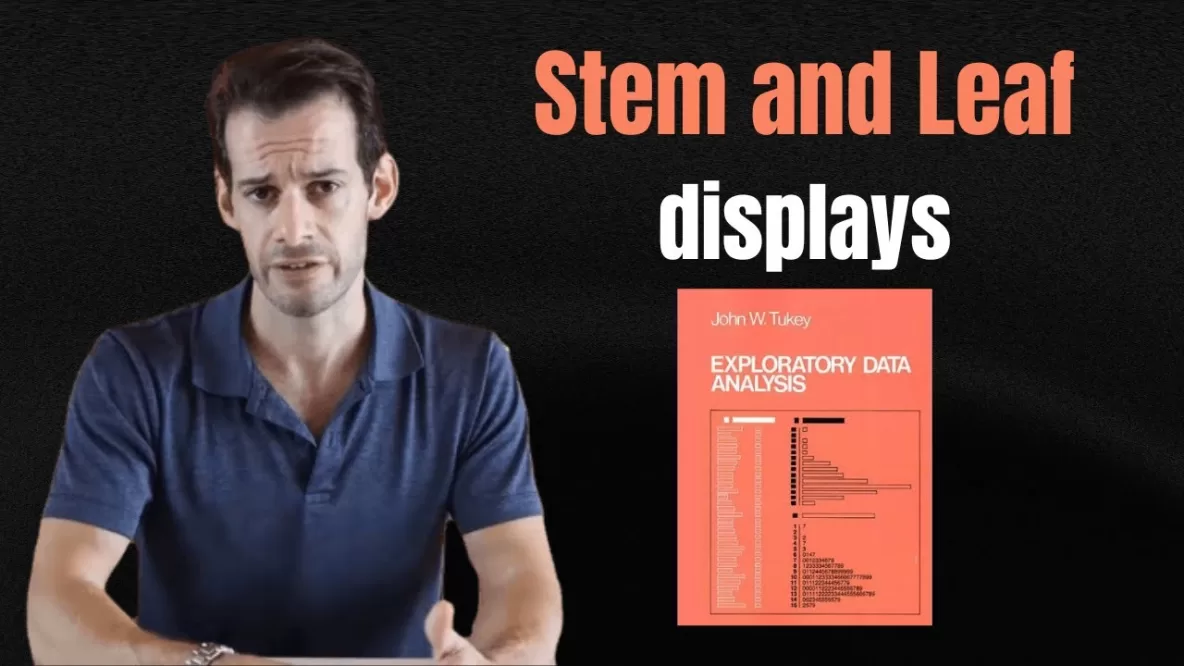
In this video I explain stem-and-leaf displays or stemplots, which are part of exploratory data analysis developed by John W. Tukey. I explain the basic design of stem-and-leaf displays as well as several variations including back-to-back stem-and-leaf displays and stretched … Read More


