In this video I describe box-and-whisker plots, or boxplots, developed by John Tukey. First we’ll look at a simple box-and-whisker plot, then we’ll see some variations depending on the data, some different sets of terminology that can be used when … Read More
How to Use Interquartile Range to Identify Outliers
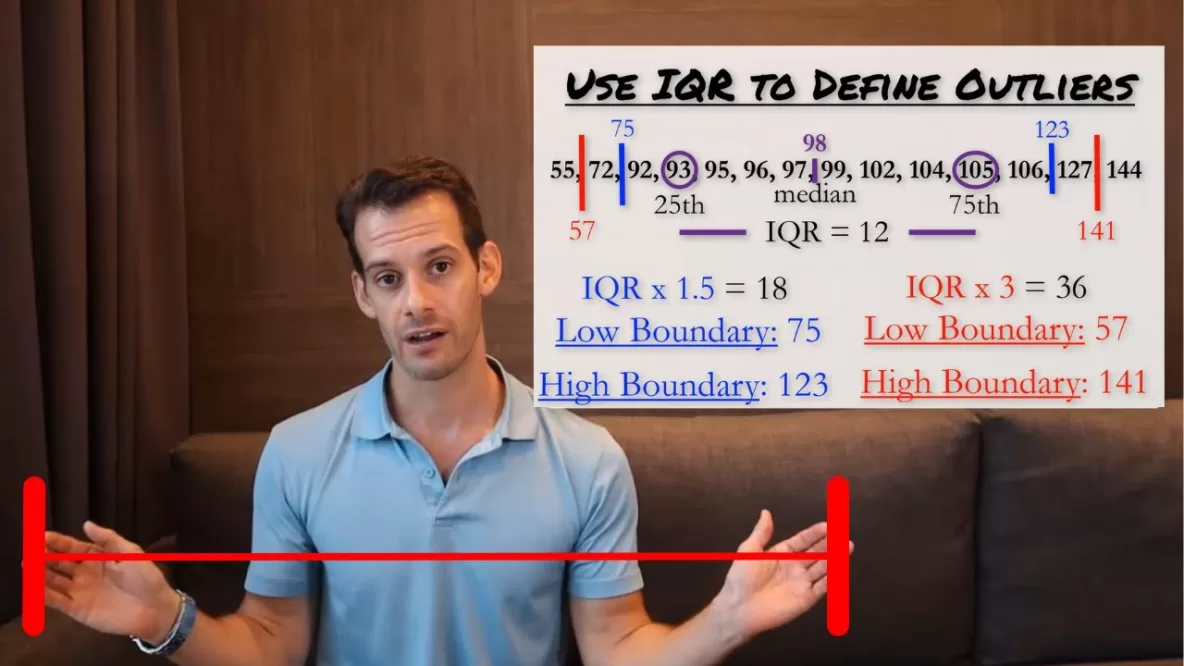
In this video I explain how to use the interquartile range in order to identify possible outliers in a data set. This can be done using the interquartile range times 1.5 for moderate outliers, or times 3 for extreme outliers. … Read More
Dispersion: Range, Interquartile Range, & Semi-Interquartile Range
In this video I explain simple ways of describing the dispersion of data that can be ordered or ranked. These are the range, the interquartile range, and the semi-interquartile range. I also briefly describe a more precise method for calculating … Read More


