
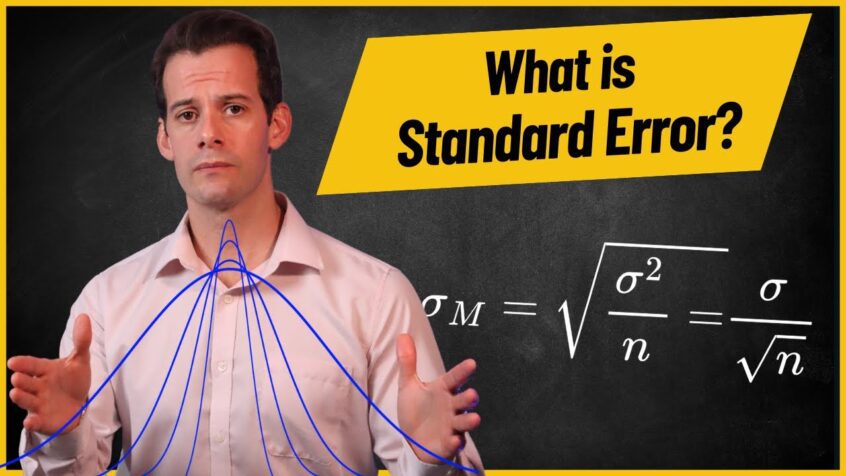
In this video I explain the sampling distribution of the mean, a comparison distribution for thinking about the probability of different mean values selected from a population. I explain how the Central Limit Theorem allows us to infer characteristics of … Read More
Statistical Significance & Probability Values

In this video I explain the concept of statistical significance, including alpha levels, probability values (p-values) and the critical region or rejection region of a comparison distribution. Video Transcript Hi I’m Michael Corayer and this is Psych Exam Review. In … Read More
The Logic of Null Hypothesis Significance Testing
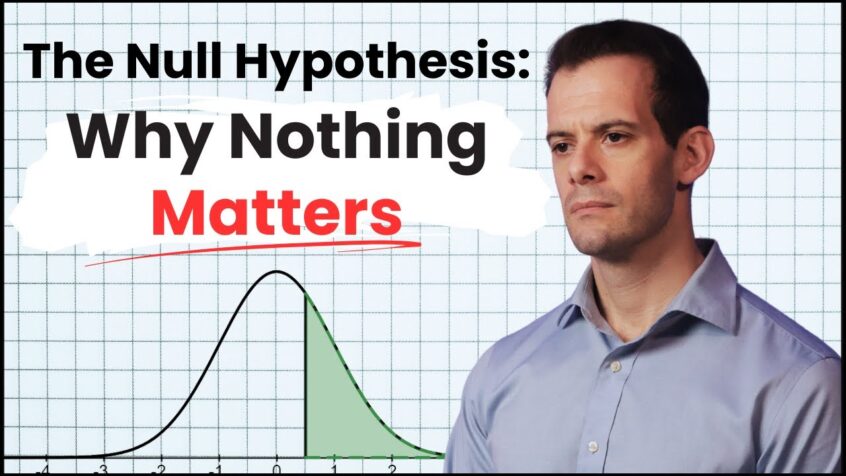
In this video I explain the logic of null hypothesis significance testing and how researchers use a null hypothesis and a comparison distribution or sampling distribution in order to assess the probability of a particular test statistic or calculation. Video … Read More
How to Use a Z-Table (Standard Normal Table)
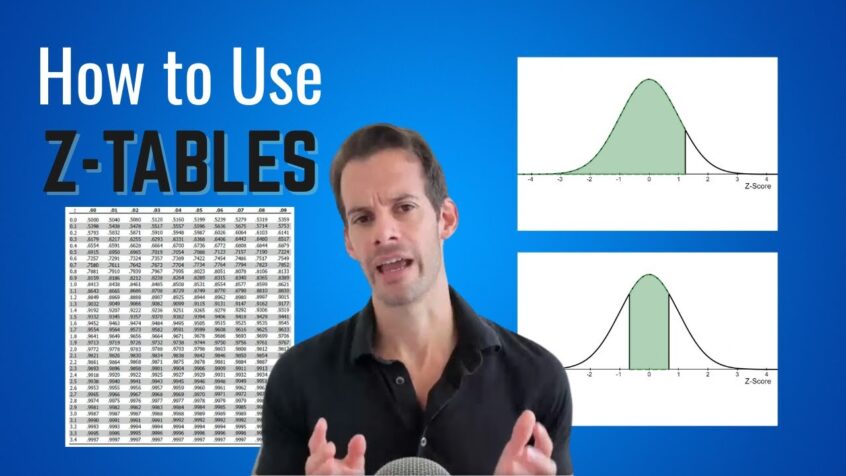
In this video I explain how to use a z-table or a standard normal table in order to calculate the percentage of scores below, above, or between z-scores for a normal distribution. Finding the areas under the curve associated with … Read More
The Standard Normal Curve, Empirical Rule, & Z-Scores

In this video I explain how we can use the equation for a normal curve to generate a probability density function and use that to estimate probabilities. While normal curves may differ in where they are centered and how spread … Read More
How Are Moments Used in Statistics?

In this video I explain how moments are used in statistics in order to describe the characteristics of a distribution. The first four moments help to tell us about the mean, variance, skew, and kurtosis of a distribution and allow … Read More
What is Kurtosis?
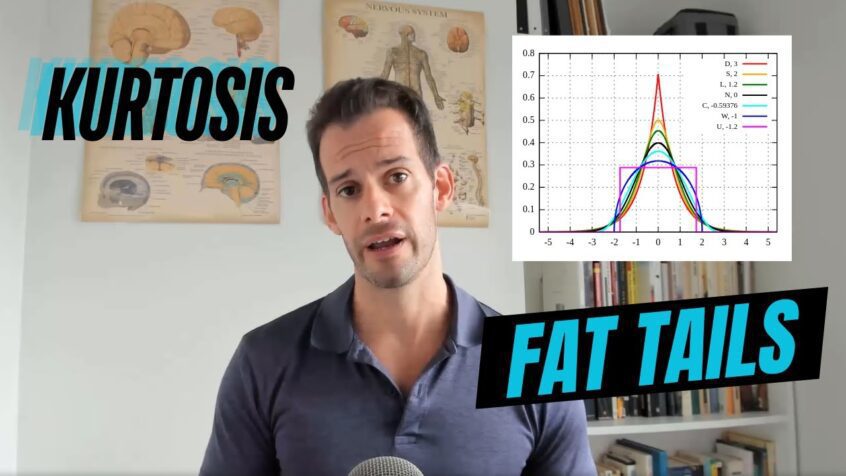
In this video I explain the concept of kurtosis. I explain the terminology for kurtosis coined by Karl Pearson, a number of common misconceptions related to kurtosis, how kurtosis is calculated for a sample, and how kurtosis is interpreted for … Read More
How to Calculate Skew
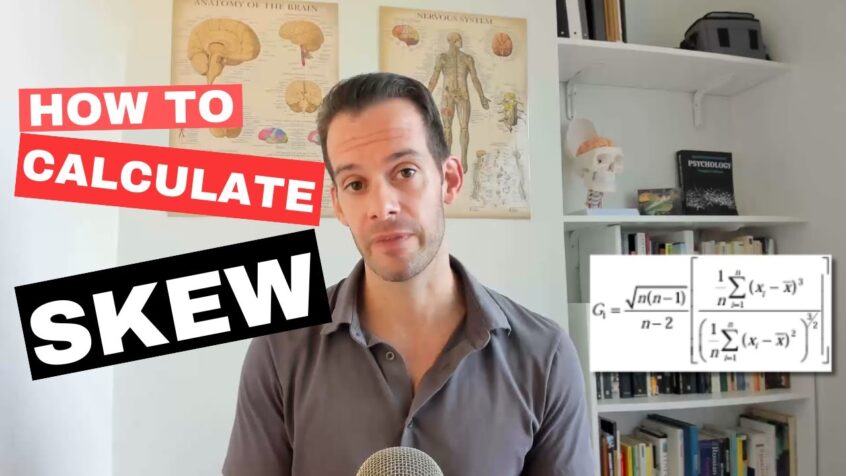
In this video I explain two formulas for calculating skew: Pearson’s Median Skewness or Pearson’s 2nd equation for skew, and the Adjusted Fisher-Pearson Standardized 3rd Moment Coefficient for skew. I also explain some general guidelines for interpreting skew values, as … Read More
Skewness – Floor & Ceiling Effects
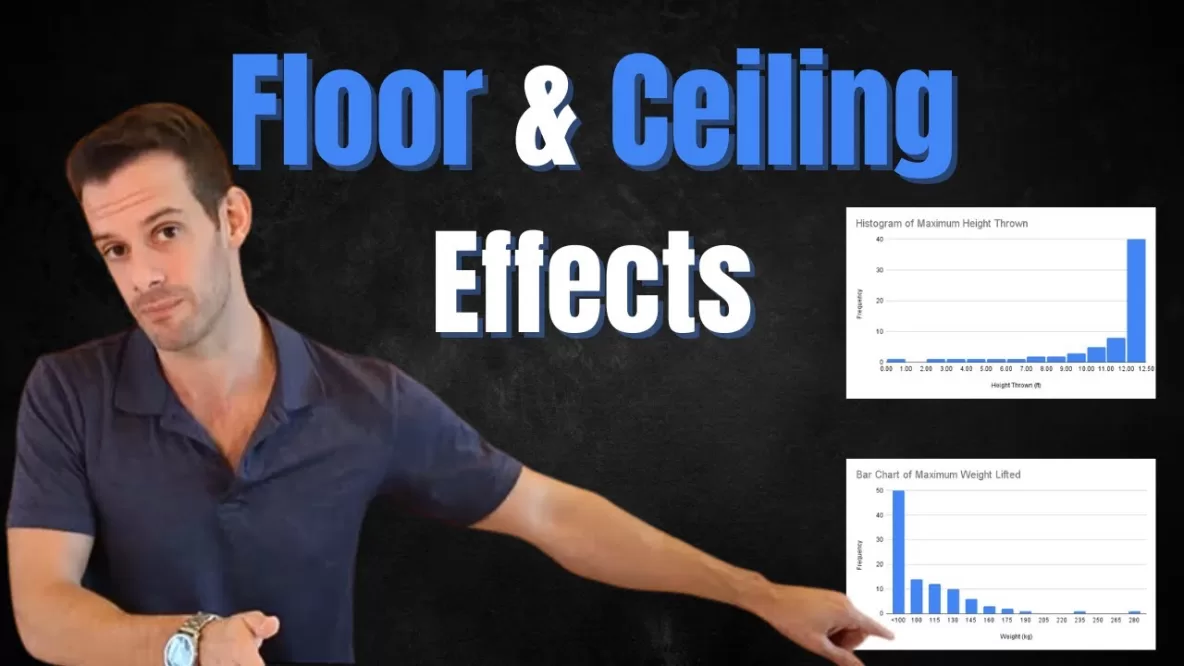
In this video I explain how skewness in a sample may be caused by a floor or a ceiling effect, in which the measurement isn’t able to capture variability at the low or high end of a population’s distribution. A … Read More
Skewness – Positive & Negative Skew
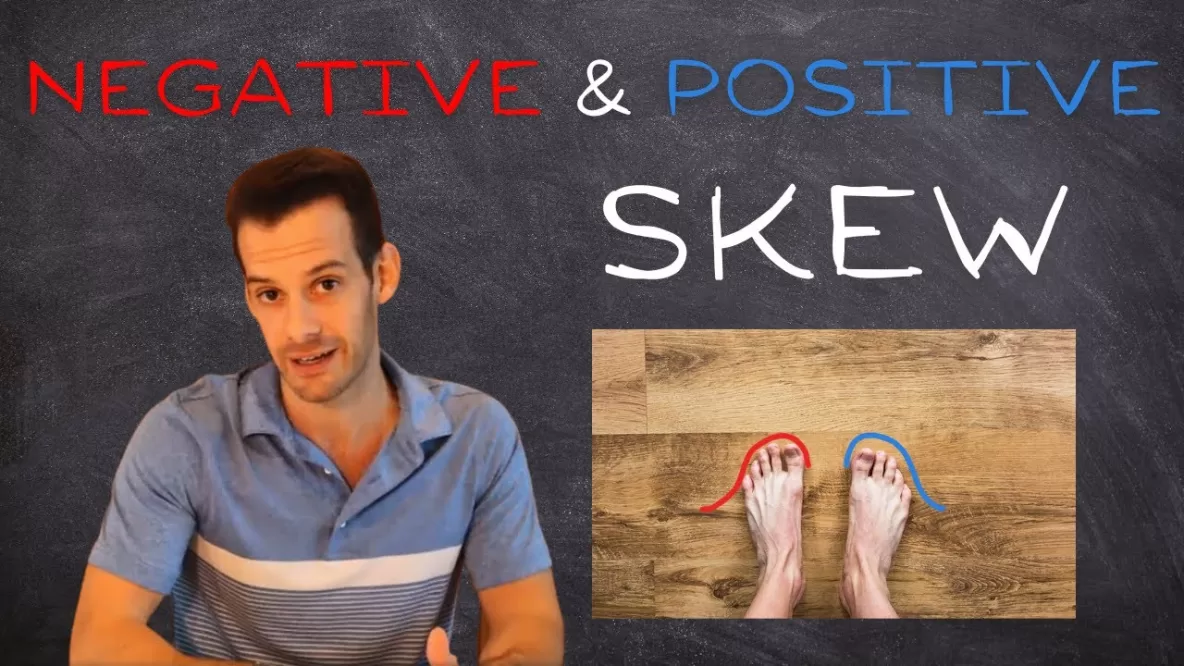
In this video I explain one way in which a distribution can deviate from normality, which is skewness. I explain the difference between positive and negative skew, and how these can be seen in histograms, stem and leaf displays, and … Read More