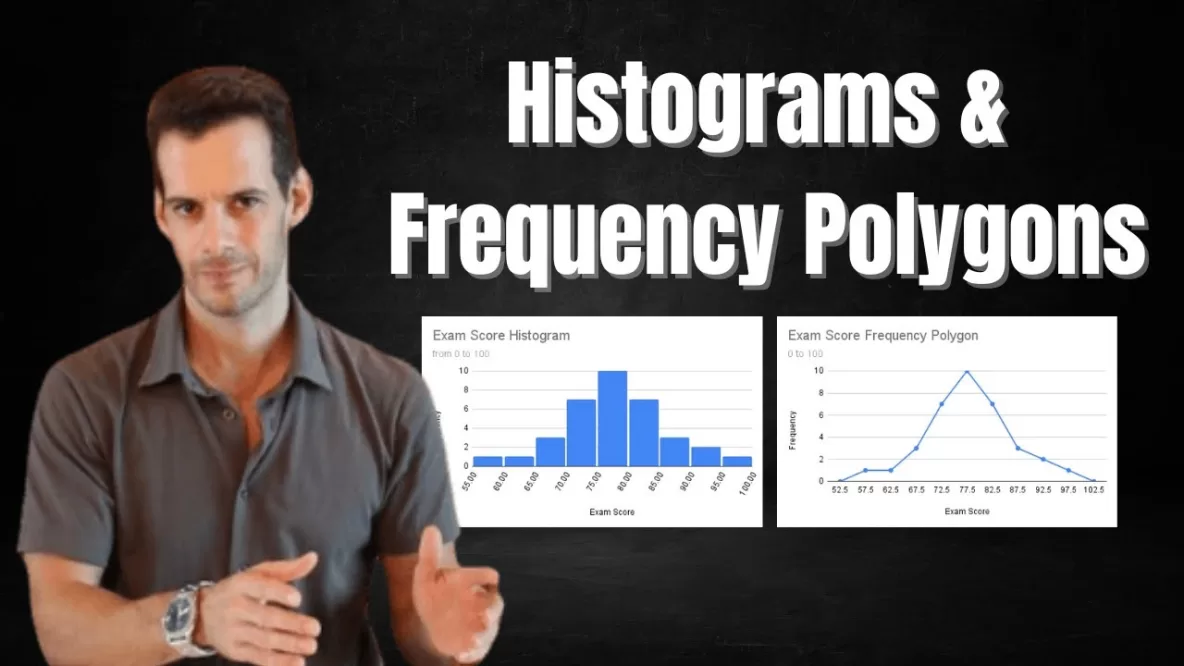
In this video I explain the difference between histograms and bar charts, look at the creation of histograms and frequency polygons for continuous variables, and then discuss why we want to get a sense of the shape of a distribution … Read More
Exploratory Data Analysis: Box & Whisker Plots
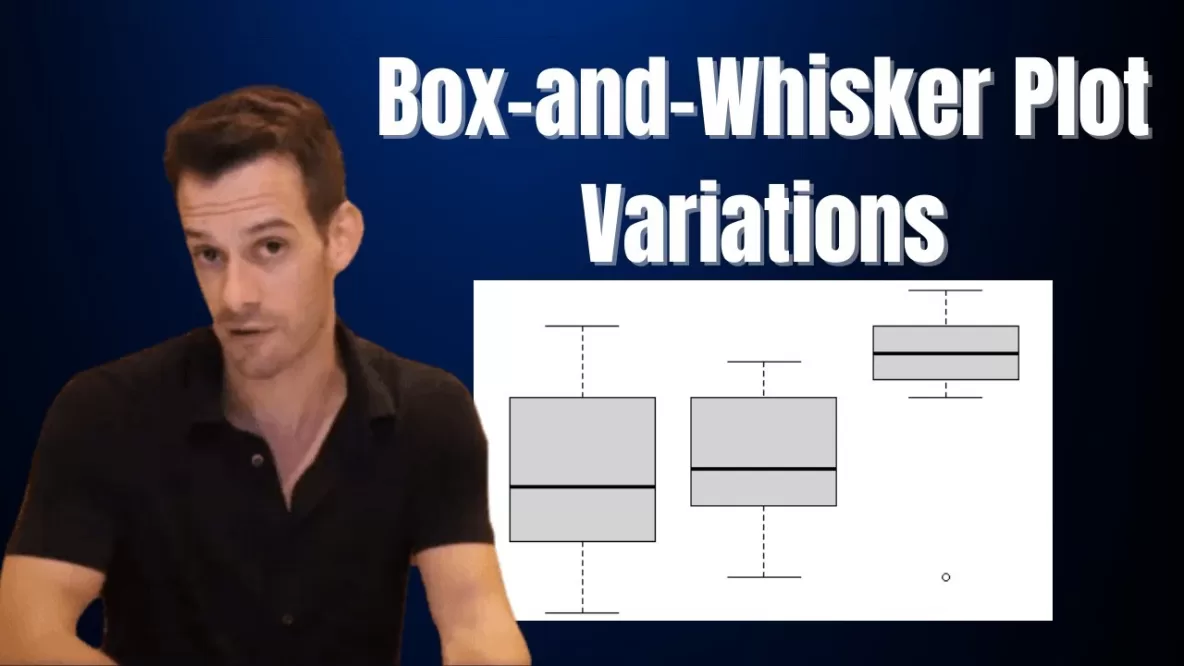
In this video I describe box-and-whisker plots, or boxplots, developed by John Tukey. First we’ll look at a simple box-and-whisker plot, then we’ll see some variations depending on the data, some different sets of terminology that can be used when … Read More
Exploratory Data Analysis: Stem & Leaf Displays
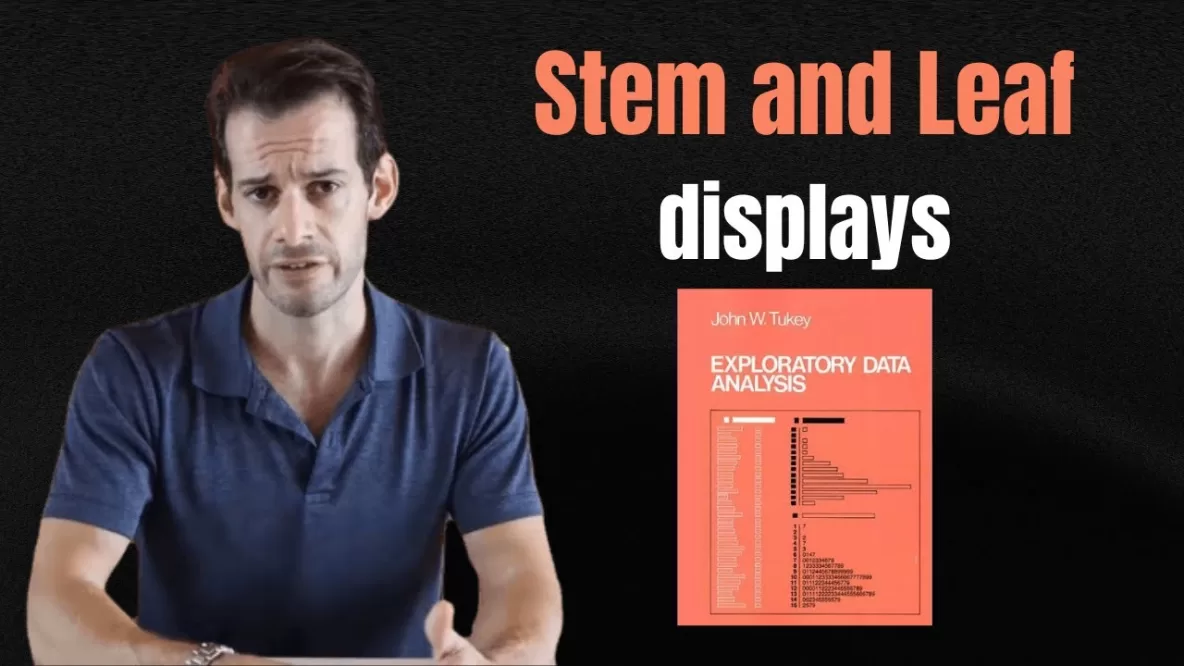
In this video I explain stem-and-leaf displays or stemplots, which are part of exploratory data analysis developed by John W. Tukey. I explain the basic design of stem-and-leaf displays as well as several variations including back-to-back stem-and-leaf displays and stretched … Read More
Understanding Central Tendency
In this video I explain the strengths and limitations of the 3 measures of central tendency: the mean, the median, and the mode. This is part of a key theme of statistics, which is the importance of the choices researchers … Read More


