
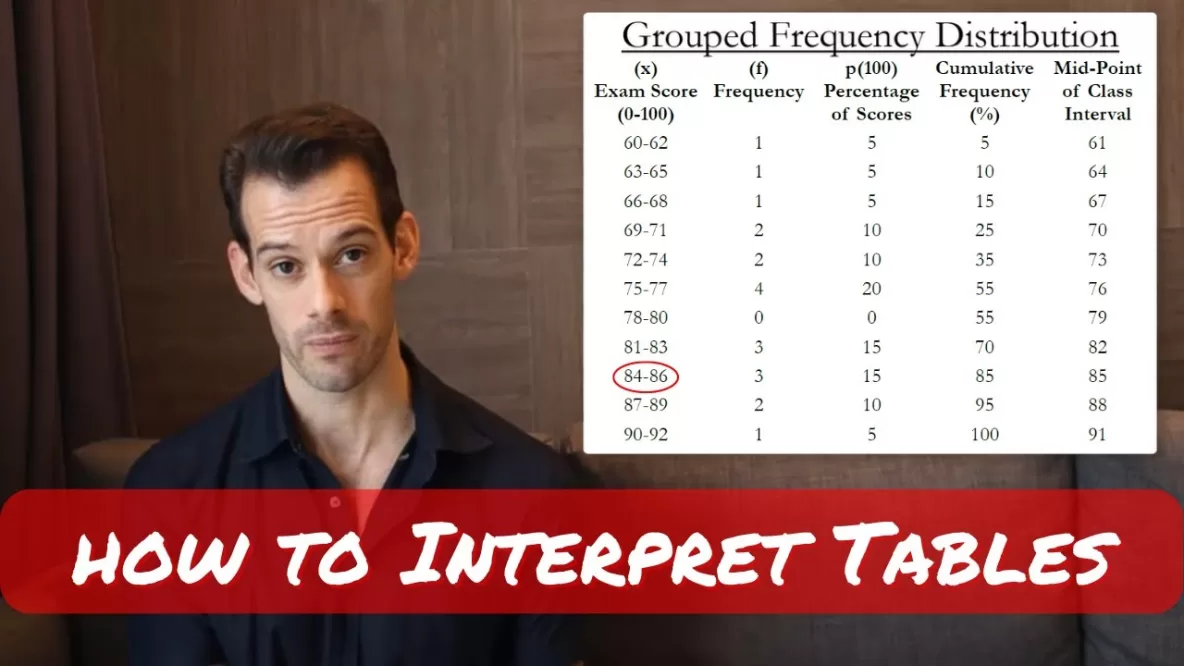
In this video I explain frequency distribution tables and grouped frequency distribution tables for summarizing data. I explain each of the columns, including the variable measured, the frequency, the proportion and percentage of the data at each variable, and the … Read More
n-1 Explained Conceptually
In this video I answer the common question of why we divide by n-1 when calculating variance from a sample, known as Bessel’s Correction. I focus on conceptual understanding of why this adjustment is needed and why n-1 is the … Read More
Mean Absolute Deviation, Variance, & Standard Deviation

In this video I explain how to use mean deviation, mean absolute deviation, variance, and standard deviation to assess dispersion in interval or ratio level data. I discuss each concept and practice calculating with a sample set of data, and … Read More
How to Use Interquartile Range to Identify Outliers
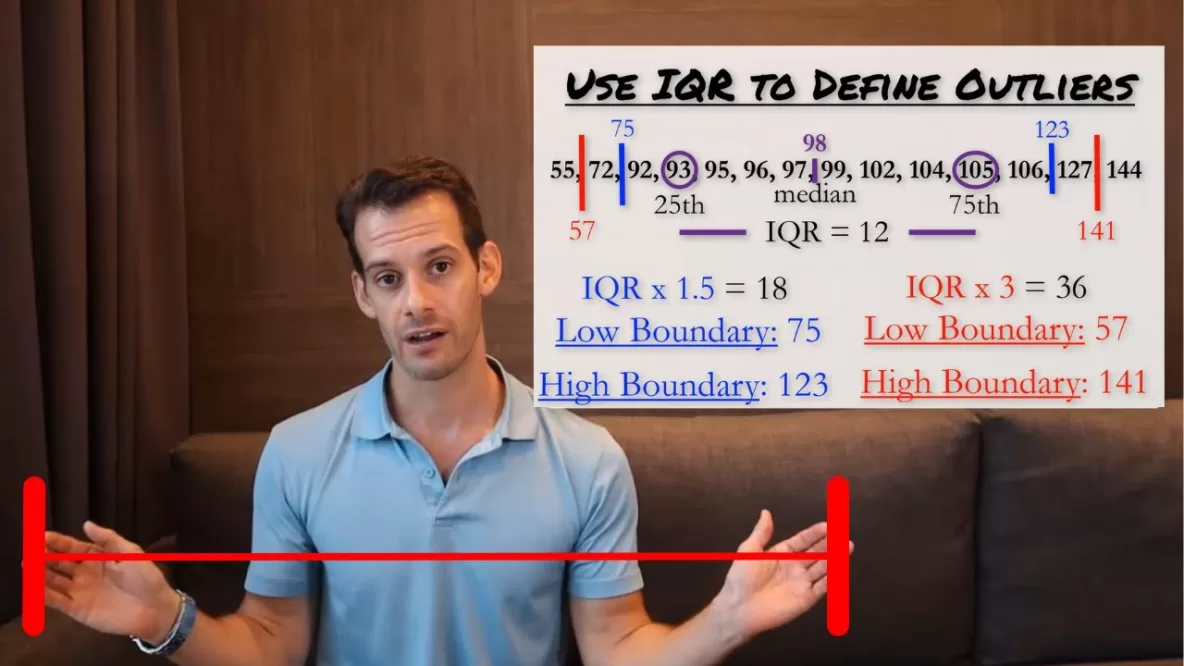
In this video I explain how to use the interquartile range in order to identify possible outliers in a data set. This can be done using the interquartile range times 1.5 for moderate outliers, or times 3 for extreme outliers. … Read More
Inclusive vs. Exclusive Interquartile Range

In this video I explain the difference between calculating an exclusive interquartile range and an inclusive interquartile range. While we generally use an exclusive interquartile range with an even set of scores, when we have an odd-numbered set of scores … Read More
Dispersion: Range, Interquartile Range, & Semi-Interquartile Range

In this video I explain simple ways of describing the dispersion of data that can be ordered or ranked. These are the range, the interquartile range, and the semi-interquartile range. I also briefly describe a more precise method for calculating … Read More