
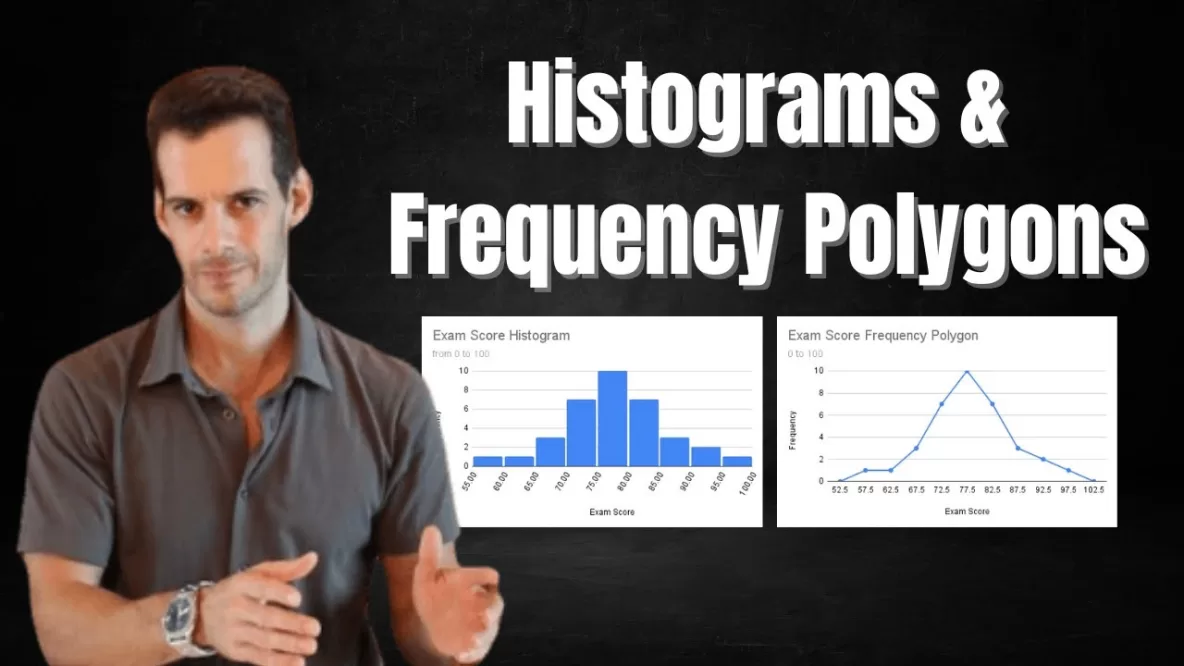
In this video I explain the difference between histograms and bar charts, look at the creation of histograms and frequency polygons for continuous variables, and then discuss why we want to get a sense of the shape of a distribution … Read More
Exploratory Data Analysis: Box & Whisker Plots
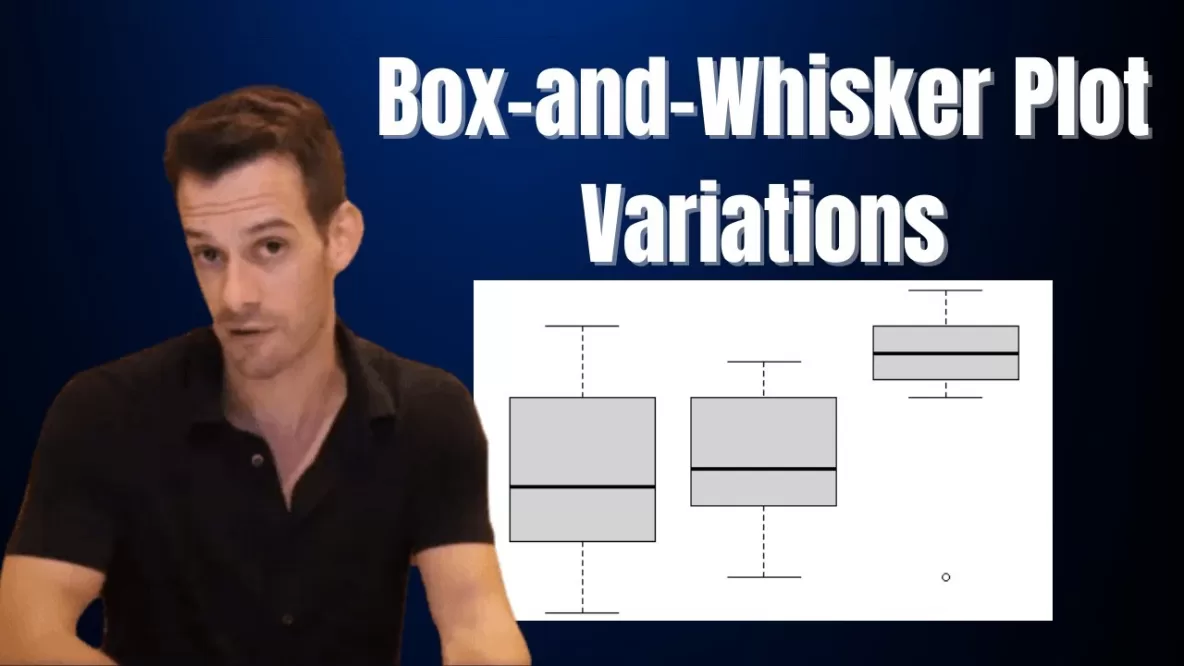
In this video I describe box-and-whisker plots, or boxplots, developed by John Tukey. First we’ll look at a simple box-and-whisker plot, then we’ll see some variations depending on the data, some different sets of terminology that can be used when … Read More
Exploratory Data Analysis: Stem & Leaf Displays
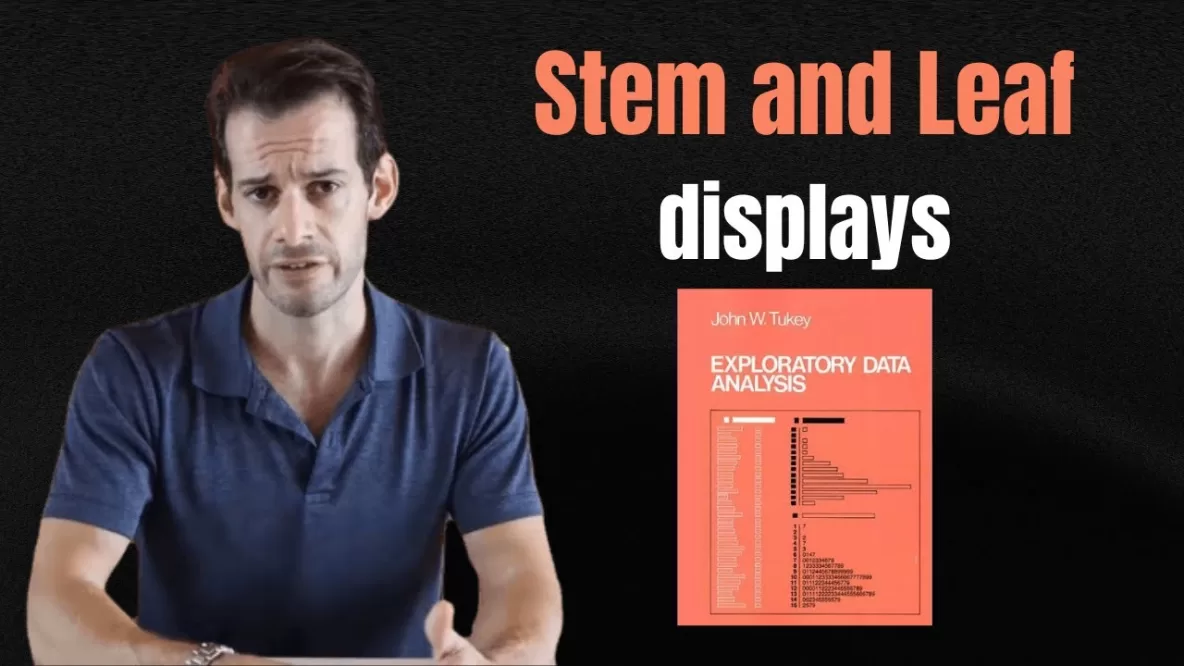
In this video I explain stem-and-leaf displays or stemplots, which are part of exploratory data analysis developed by John W. Tukey. I explain the basic design of stem-and-leaf displays as well as several variations including back-to-back stem-and-leaf displays and stretched … Read More
How to Interpret (and Create) Frequency Distribution Tables
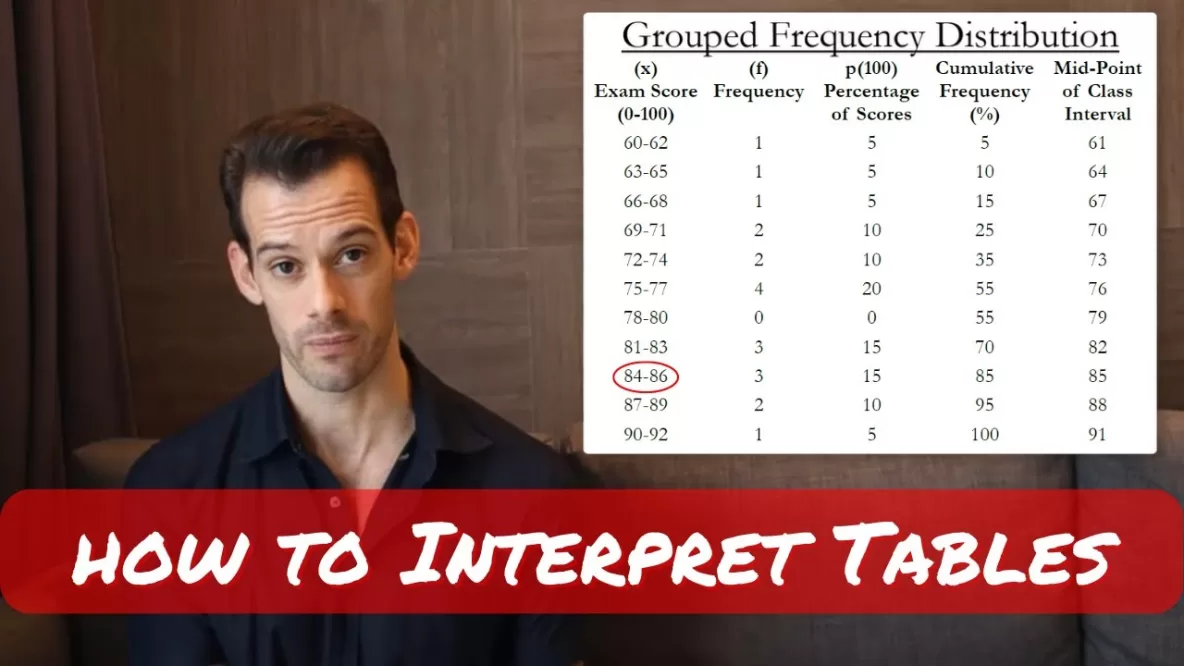
In this video I explain frequency distribution tables and grouped frequency distribution tables for summarizing data. I explain each of the columns, including the variable measured, the frequency, the proportion and percentage of the data at each variable, and the … Read More
n-1 Explained Conceptually
In this video I answer the common question of why we divide by n-1 when calculating variance from a sample, known as Bessel’s Correction. I focus on conceptual understanding of why this adjustment is needed and why n-1 is the … Read More
Mean Absolute Deviation, Variance, & Standard Deviation

In this video I explain how to use mean deviation, mean absolute deviation, variance, and standard deviation to assess dispersion in interval or ratio level data. I discuss each concept and practice calculating with a sample set of data, and … Read More
How to Use Interquartile Range to Identify Outliers
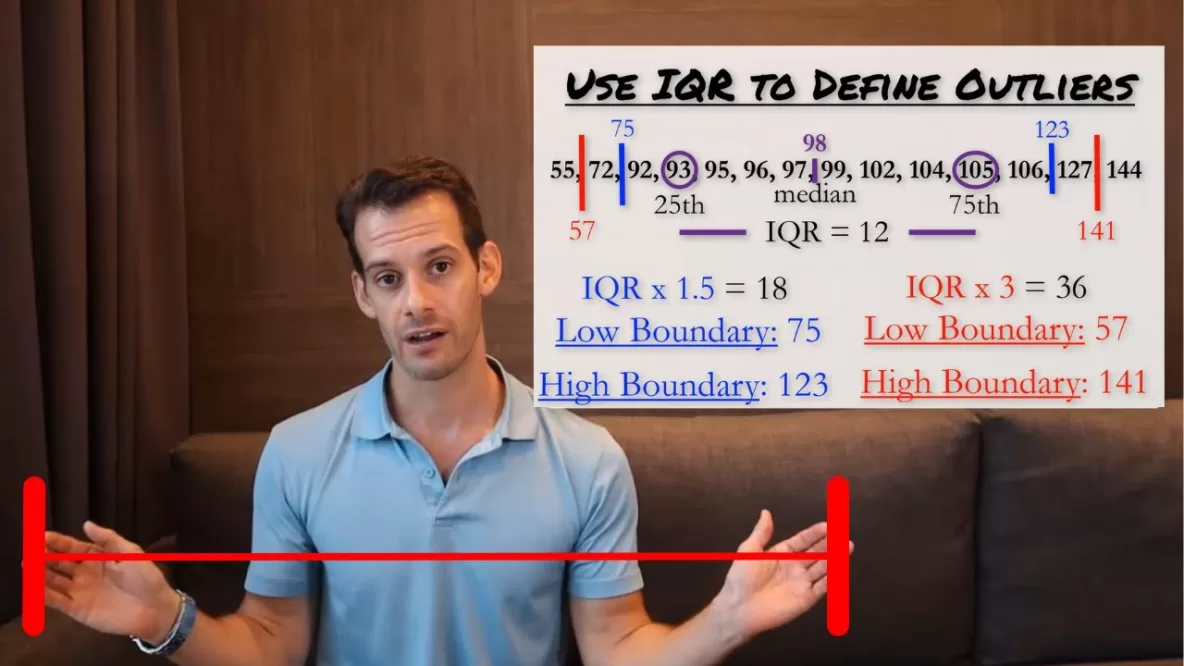
In this video I explain how to use the interquartile range in order to identify possible outliers in a data set. This can be done using the interquartile range times 1.5 for moderate outliers, or times 3 for extreme outliers. … Read More
Dispersion: Range, Interquartile Range, & Semi-Interquartile Range

In this video I explain simple ways of describing the dispersion of data that can be ordered or ranked. These are the range, the interquartile range, and the semi-interquartile range. I also briefly describe a more precise method for calculating … Read More
Dispersion for Nominal Data: The Variation Ratio
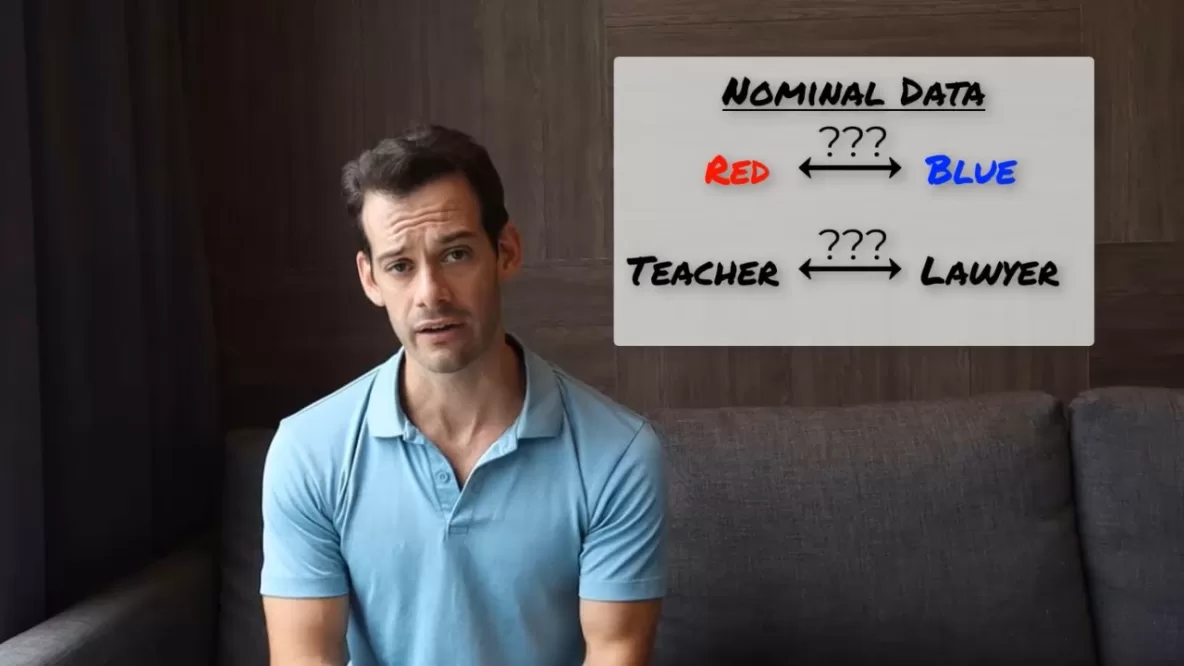
In this video I describe how we can describe dispersion or variability in nominal data by calculating a variation ratio. This is a simple measure of spread that tells us the frequency of scores that differ from the mode, which … Read More
How to Find the Precise Median (Interpolated Median)
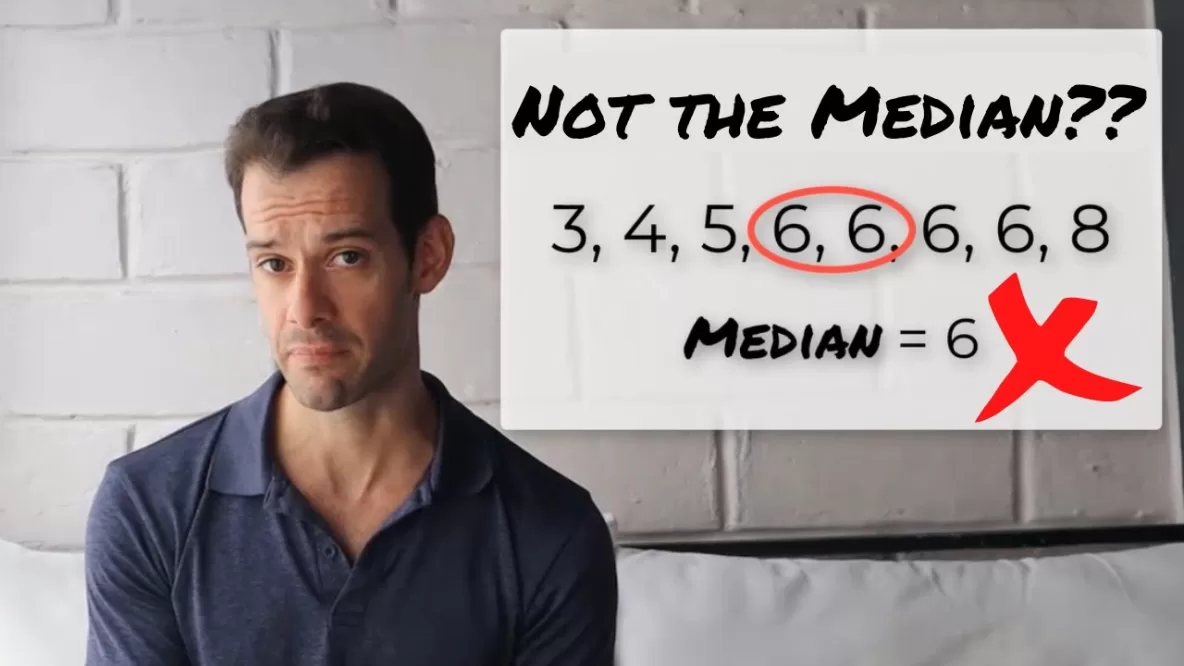
In this video I explain how to find the precise median for a continuous variable with many repeated scores. I walk through an example of this that can be solved visually, then use this example to derive the formula for … Read More